You always get to that point, when
teaching something easy, that you start to cross over into the realm
of the slightly more complicated. That was what happened when I
started showing how to use a transistor to buffer an Arduino output
to switch a 12V load. So we started going into current amplifiers,
Vbe and Vce, Saturation and configurations.
The next day, on my way to a meeting I
was struck with the idea that an Arduino could make it really easy to
show how a transistor works – and it would be more understandable
because the students would build it themselves.
The theory
A transistor is a current controlled
device. It will control the current through the collector to be a
multiple of the base current as long as that current is
available.The last part
is important. If you have a supply that can only provide 10 mA, there
is no way that the transistor can manufacture more. It can only allow
the current available to pass or restrict it.
Ic = max (β
x Ib ,,available)
where
Ic
is the collector current, β
is the gain and Ib is
the current into the base.
In
common emitter mode, the load and the supply voltage determine the
maximum available current. So, for example, a 100 ohm load to a 5V
supply cannot possibly supply more than 10 mA to ground by virtue of
ohms law.
The
Implementation
The idea was to start off with
something incredibly simple that the students could understand – so
I settled on manual control of the input voltage using a
potentiometer.
The transistor and the two resistors form part of the test circuit.
Test Circuit Diagram
Thus the Arduino is able to measure the source
voltage, the base voltage and the collector voltage as you change the potentiometer position.
Thus Ib
can be determined by ( Vs – Vb ) / Rb
and Ic
can be determined by (5V - Vc) / Rc
This was easily wired up on a
breadboard as follows
The Arduino code
Since we want to graph the output, we
will send it to a host computer via the USB Serial link. This reduces
the requirements of the Arduino code to reading the analog inputs,
converting them to voltages and transmitting them.
Since the Arduino has 12 bit analog
inputs (0-1023) where 0 represents 0V and 1023 represents 5V we need
to scale the analog readings.
V = analogRead( port ) * 5 / 1023
We then combine the three readings into
a single text line and transmit them in text mode to the computer.
Using plain text makes it far easier to debug the program on both
sides. As a result, the Arduino code is really simple.
void setup() {
Serial.begin(9600);
}
void loop() {
float bvc = analogRead(A0);
float bvb = analogRead(A2);
float bvs = analogRead(A3);
// convert to volts
float vc = 5.0*bvc/1024.0;
float vb = 5.0*bvb/1024.0;
float vs = 5.0*bvs/1024.0;
// transfer in one single line
Serial.print(vc);
Serial.print(",");
Serial.print(vb);
Serial.print(",");
Serial.println(vs);
delay(500);
}
And that's it! The program simply reads
the voltages and sends them to your computer which has the job of
interpreting and displaying the data!
We use the computer to receive and
display the data so we write a small program in processing that will
read the data from the serial port and store it into a list
structure. A serial event is generated every time a new line of text
arrives. The data is extracted and put into an object which is
stored in an ArrayList. The ArrayList is sorted based on Ib as each
item is added because data can come in out of order as you twiddle
the potentiometer knob. If you turn too fast you will start with a
very rough graph. You can refine it by turning it backwards and
forwards – or turning it slowly.
The program then draws a graph
background and plots the required graph as selected by the user.
The program then draws a graph
background and plots the required graph as selected by the user.
Options available:
Ib / Ic - press C
Ib / Vc - press V
Vs / Vc - press B
Additionally P clears the graph and Q
will close the connection to the Arduino
Since the Processing code is somewhat more involved, you can download it from GitHub from the link at the end of this article. The raw data gives us the following curve:
Collector Voltage vs Input Voltage
This is a plot of the raw data from the Arduino - but is really only useful for understanding exactly this configuration (with these exact resistors). However it does show you that you have an inverting amplifier.
Calculating using the values of the two resistors allows us to determine the current and get Ib / Vc and Ib / Ic plots
Variation of Vc with Ib
Variation of Ic with Ib
Results
The Ib/Ic curve shows the tail off of the
gain when the transistor reaches saturation. The saturation occurs
not because of the transistor but because the resistor cannot allow a current of more 5v/Rc to pass given the 5V supply.
As you play with the potentiometer, you will notice that more points make the curve smoother.
Depending on the consistency of your connections you may experience a
few glitches but you get enough data to see the pattern.
One reason you may get some glitches is that you may be moving the potentiometer too fast, thereby causing some inconsistency in the potentiometer value between the three readings.
Improvements
The circuit seems to work pretty well –
and the curves are OK except that they are a bit jagged.
On refelection, we are assuming that
all three readings are under simultaneous conditions when in fact,
moving the potentiometer means that the readings are not at the same
point. Just as important, we cannot cover a smooth range of input
voltages (Vs) because we are manually turning a knob on the
potentiometer.
The obvious first improvement would be
to replace the potentiometer with something similar but controllable
by the Arduino. Two contenders would be either a Digital to Analog
convertor or a Digital Potentiometer. In this design I settled for a
Digital Potentiometer for the scientifically precise reason that
Element14 had some in stock so they arrived before the DAC chips.
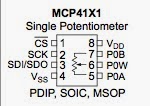
Hence I settled on the MCP4131 Single Channel 7 bit Digital
Potentiometer.
The MCP4131 is an SPI device with a
small difference. I will be covering the nuts and bolts of SPI in another post. This device shares SDI and SDO so you need to add a small change from the usual circuit - which is a single resistor as shown by this note in the data sheet.
The calculations required by Note 2 are
that
When the first edge is asserted,
the resistor must be low enough to allow the CPU to drive the
device's pins both high and low
When the second edge is asserted,
the resistor must be high enough to allow the device to override the
CPU's outputs.
The calculations require reading both the CPU and device's data sheets but show that in practice there are quite a wide
range of values possible. I selected a 4.7K resistance out of sheer
instinct.
This is really simple to implement as shown below.
And the wiring is just as easy
Revised wiring using MCP4131 digital Potentiometer
One important thing to note is that
although it is a seven bit device, the vales range from 0 to 128, not
127 as you would normally imagine.
Use of the MCP4131
#include <SPI.h>
#include
<MCP4131.h>
//setup
an instance of MCP4131
MCP4131
MCP4131(10); // with a CS pin of 10
In the setup
code
MCP4131.setTap(MCP4131_MIN);
//Sets the pot to 0.
if
(MCP4131.initTCON()) //init the pot, connect wiper0, and turn ON pot
{
Serial.println("Init
Error!");
}
And in the loop (with a variable
“tapValue” which is suitably declared and controlled somewhere)
if
(MCP4131.setTap(tapValue))
{
Serial.println("setTap
Error!");
}
And that's it.
Since I had to write changes to the
Arduino code to use the MCP4131, I also modified it to do a single
sweep of the Potentiometer (with tapValue from 0 to 128) and then
stop until it received a “G” on the serial port.
Then I
modified the Processing code to send the G when the user requested
for a new graph to be drawn.
The result was far smoother graphs.
That's is about it. There is a ton of future work to be done - starting with different transistor configurations.
See the GitHub repositories below for code: